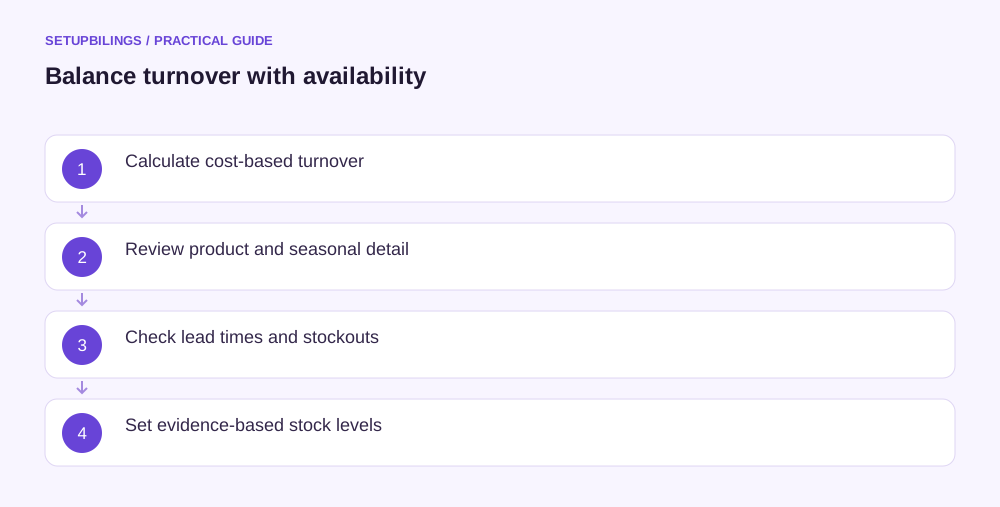
Inventory turnover measures how many times the business’s average recorded inventory is represented by the period’s cost of goods sold. A common cost-based formula is cost of goods sold ÷ average inventory. Faster turnover can release funds and reduce ageing risk, but it can also conceal inadequate stock and lost sales.
Use the ratio to examine inventory efficiency while protecting the availability customers need. The right balance depends on demand variability, supplier lead time, order quantities, product criticality and the cost of a stockout. A company-wide turnover target cannot answer all those questions.
Use a consistent cost-based calculation
For a simple average, add opening and closing inventory and divide by two. Use inventory measured on a cost basis with cost of goods sold in the numerator. A sales-based turnover definition exists in some reports, but it is affected by gross margin and must be labelled separately.
An illustrative Lucknow plumbing distributor has annual cost of goods sold of ₹72 lakh, opening inventory ₹10 lakh and closing inventory ₹14 lakh. Average inventory is ₹12 lakh. Turnover is ₹72 ÷ ₹12 = 6 times.
Inventory days, using a 365-day year, are 365 ÷ 6 = about 60.8 days. This is an average relationship between cost flow and inventory, not proof that every item sits exactly 61 days before sale. Slow and fast products can coexist within the total.
| Measure | Calculation | Result |
|---|---|---|
| Average inventory | (₹10 lakh + ₹14 lakh) ÷ 2 | ₹12 lakh |
| Annual turnover | ₹72 lakh ÷ ₹12 lakh | 6 times |
| Inventory days | 365 ÷ 6 | 60.8 days |
For a shorter period, use the days in that period when calculating holding days. Do not divide a single month’s cost by stock and then apply an annual-days multiplier without appropriate annualisation and a clear explanation.
Improve the average when stock is seasonal
Opening and closing balances can misrepresent a business that builds inventory before a festival, monsoon or agricultural season. Monthly or weekly average balances often give a better view of funds committed during the period.
Suppose the distributor’s opening and closing inventory are both ₹8 lakh, but monthly stock peaks at ₹20 lakh before a demand season. A two-point average of ₹8 lakh understates the typical investment if stock stayed elevated for several months. Use the full monthly series and show the seasonal peak separately.
Keep valuation methods consistent. Purchase-price inflation, write-downs or category reclassifications can change the rupee ratio even when physical quantities behave differently. Review units and costs together before interpreting the trend.
Ask whether higher turnover came from better planning
If average inventory falls from ₹12 lakh to ₹9 lakh while cost of goods sold stays ₹72 lakh, turnover rises from 6 to 8 times and holding days fall to about 45.6. Recorded funds tied up in average stock fall ₹3 lakh.
That can be a useful improvement if order fulfilment remains dependable. Check customer fill rate, backorders, emergency purchases, delivery delays and sales lost because items were unavailable. A ratio improvement achieved by repeatedly turning customers away has a hidden cost.
Suppose emergency sourcing and expedited freight add ₹0.8 lakh annually, while stockouts reduce gross profit by an estimated ₹1 lakh. Those estimates need evidence, but they show why releasing ₹3 lakh of inventory should not be judged without the operating consequences.
Separate products by their role
A fast-moving pipe fitting, a slow-moving premium tap and an essential repair component should not necessarily carry the same stock policy. Review turnover by product family and, where possible, individual item. Combine this with demand frequency, value and supply risk.
Critical spares may justify lower turnover because an immediate replacement prevents a costly customer shutdown. Seasonal products may need a planned build and rapid clearance after the season. Obsolete or duplicated items need a disposal or purchasing decision rather than a higher blanket stock allowance.
Distinguish genuine safety stock from forgotten stock. Ask what uncertainty the buffer covers and whether recent supplier performance or demand evidence supports it. A label in a spreadsheet does not establish a continuing commercial need.
Check replenishment constraints
Lead time affects how little stock the business can safely hold. If a supplier takes 30 days to deliver and demand is variable, a target implying only ten days’ cover may be unrealistic without another dependable source.
Minimum order quantities, transport economics, import cycles and supplier shutdowns can also affect stock levels. Compare the cost of carrying additional inventory with the cost and risk of smaller or more frequent replenishment. Use realistic payment terms because supplier credit changes the funding burden.
Availability also depends on data quality. Incorrect units, duplicate item codes, unrecorded returns and stock in the wrong warehouse can produce apparent shortages while total inventory remains high. Review physical location and count accuracy before cutting the purchase budget.
Read low turnover and valuation together
Low turnover can indicate excess stock, but inspect ageing and expected selling proceeds before deciding. ICAI AS 2 measures inventories within its scope at the lower of cost and net realisable value. Damaged or obsolete goods may require a valuation adjustment as well as a commercial clearance plan.
A write-down reduces the inventory denominator and can make later turnover look better without selling a single extra unit. Explain that effect separately. Similarly, a large sale of old stock can improve cash while sacrificing margin; show both outcomes.
Finish with a balanced stock dashboard: turnover, days, ageing, fill rate, backorders and emergency-purchase cost. The owner’s aim is to hold the right inventory for dependable sales while avoiding unsupported investment in goods that no longer serve demand.