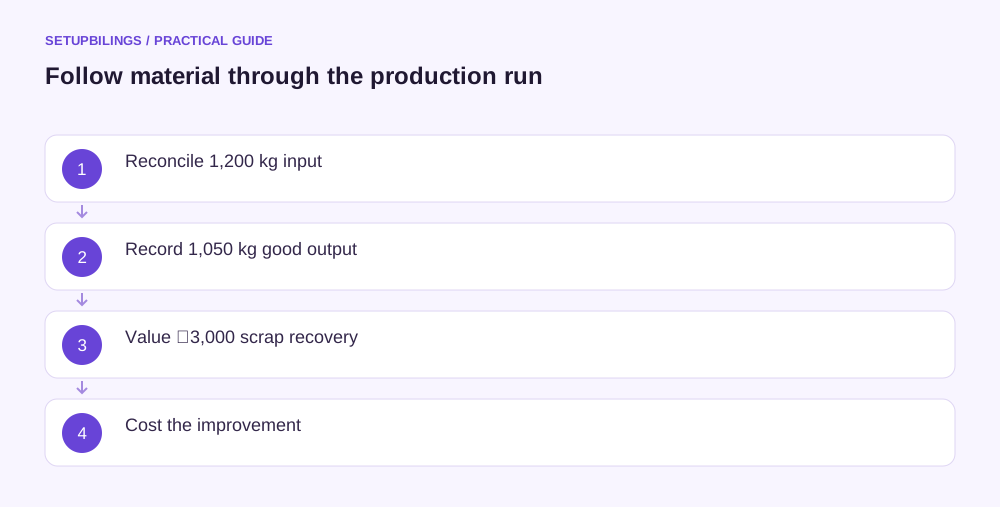
Measure the financial cost of production wastage by first reconciling physical input with good output, scrap, process loss and work still in progress. Then value the relevant material, processing and disposal effects, deduct supported recoveries, and distinguish normal process loss from abnormal events. A waste percentage without a quantity balance can conceal missing stock or measurement errors.
For an MSME manufacturer, this approach reveals where yield improvement creates value. It also prevents an overstatement of savings when scrap already earns some recovery or when the proposed improvement requires extra processing expenditure.
Build a physical quantity balance
Consider an illustrative Ahmedabad plastics processor using 1,200 kilograms of input during a completed production run. It records 1,050 kilograms of good output, 100 kilograms of saleable scrap and 50 kilograms of process loss. The quantities reconcile to the 1,200-kilogram input.
Good-output yield is 1,050 divided by 1,200, or 87.5%. Scrap is 8.33% of input and process loss approximately 4.17%. State the denominator. A reject rate based on finished units and a material-loss rate based on input weight are different measures.
ICAI's process-costing material distinguishes normal and abnormal process loss. Normal loss should have technical or operational support; it is not simply whatever waste happened last month. AS 2 separately excludes abnormal wasted production costs from inventory cost.
Value the material effect and recovery
Assume input material costs ₹150 per kilogram, giving ₹1,80,000 input cost. Saleable scrap realises ₹30 per kilogram, or ₹3,000, with no additional selling cost in this simplified example.
| Illustrative run measure | Quantity or amount |
|---|---|
| Input material | 1,200 kg |
| Good output | 1,050 kg |
| Saleable scrap | 100 kg |
| Process loss | 50 kg |
| Input material cost | ₹1,80,000 |
| Scrap recovery | ₹3,000 |
| Material cost net of recovery | ₹1,77,000 |
The management material-cost burden per good kilogram is ₹1,77,000 divided by 1,050, or about ₹168.57. This is higher than the ₹150 input price because good output must carry the economic effect of material not becoming saleable product, after the scrap recovery.
This simple burden measure does not replace the detailed accounting treatment of normal and abnormal loss. Keep abnormal events and their costs separately identifiable rather than automatically absorbing them into inventory.
Add processing costs at the stage of failure
Waste identified after final finishing has consumed more labour, power and machine capacity than waste identified at initial cutting. Record the production stage where the defect or loss occurs. Use the costs incurred to that stage, not the cost of an entirely finished unit for every rejected item.
Include rework labour, extra consumables, sorting and disposal where they arise. If scrap can be reused, estimate the usable recovery after reprocessing costs and quality constraints. Internal reuse is not automatically worth the original input purchase price.
Avoid counting a defective unit as both a full scrapped item and a reworked saleable item. Give the event one identity and record the final disposition: repaired, downgraded, reused, sold as scrap or disposed of.
Test the value of a specific improvement
Suppose a process change converts 30 kilograms of the example's scrap into additional good output, leaving input unchanged. Good output becomes 1,080 kilograms, scrap falls to 70 kilograms, and process loss remains 50 kilograms.
Scrap recovery falls by ₹900 because 30 kilograms no longer sell at ₹30. If the additional good output can sell for ₹300 per kilogram and needs ₹60 further processing per kilogram, it generates ₹7,200 before the lost scrap recovery. Net incremental benefit is ₹6,300 before the cost of the improvement itself.
The benefit depends on real demand and available finishing capacity. If the extra output cannot be sold or displaces other profitable production, the value changes. Do not multiply recovered quantity by selling price and describe the entire amount as a saving.
Investigate causes before setting targets
Break the waste record down by material grade, machine, shift, supplier and defect type where those distinctions help action. A changing product mix can raise the aggregate waste percentage even when each process performs consistently.
Check scales, moisture changes, unit conversions and opening work in progress. A quantity discrepancy may be a measurement issue rather than a physical loss. Resolve the balance before assigning responsibility.
Use a technically supported baseline and review it after equipment or material changes. A target of zero loss may be unrealistic for an inherent process characteristic, while an unchallenged historical percentage can normalise avoidable defects.
How often should waste be measured?
Use a frequency that matches the process and the ability to respond. A high-value batch can justify a run-level reconciliation, while a stable continuous process may use shift or daily records. Waiting until month-end can make the physical cause difficult to investigate.
Keep the measurement point consistent. Input weighed before moisture adjustment cannot be compared casually with output weighed under different conditions. Train staff on the units, timing and disposition codes, then spot-check a few records against physical movements. Reliable basic measurements are often more valuable than an elaborate financial dashboard built on inconsistent weights or incomplete scrap records.
Turn measurement into a focused control
Choose one high-value waste stream, assign an owner and compare good yield, recovery and total relevant cost before and after the change. Record the implementation expenditure and any effect on cycle time or quality.
Reconcile scrap sales and disposal records with production quantities. Missing recoveries can weaken both cost analysis and stock control. A useful wastage report shows where material went, what value was recovered and which practical change can produce more usable output from the next purchase of input.