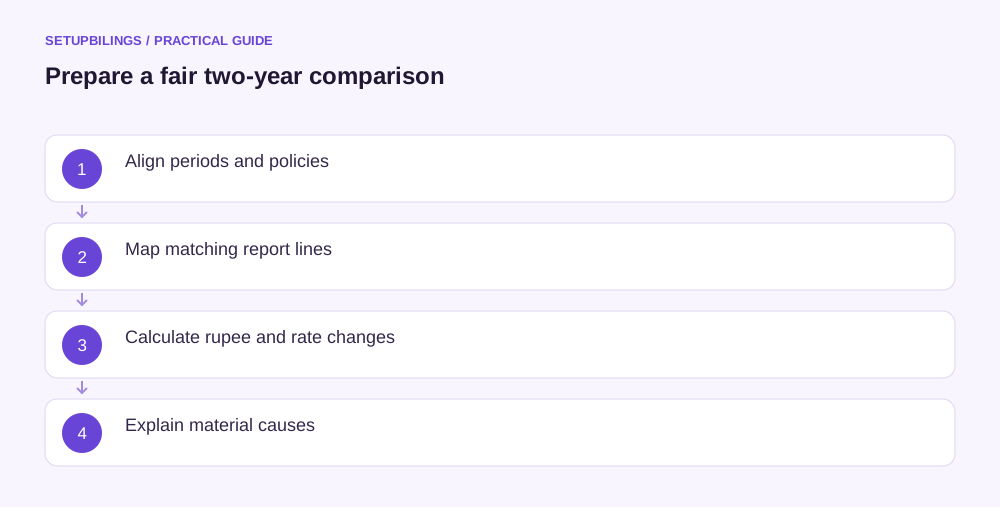
Create comparative financial statements by placing two consistent reporting periods side by side, calculating absolute and percentage movements, and explaining the changes that matter. The calculation is simple; ensuring that both columns mean the same thing takes more care. A change in stock classification, reporting length or accounting policy can otherwise look like a business trend.
A useful comparison includes the balance sheet, profit and loss statement and, where prepared, cash flow statement. It should preserve the original reported totals and clearly identify any regrouping used for analysis. Do not silently rewrite last year’s figures to produce a smoother story.
Make the two periods comparable
Confirm that both columns cover the same legal entity and reporting perimeter. Identify acquisitions, closures, new branches or a change from standalone to consolidated reporting. If one period contains twelve months and the other nine, ordinary growth percentages need qualification.
Check the currency unit and rounding. Comparing ₹ lakh with ₹ thousand is an obvious risk, but subtler mismatches arise when one report shows sales including a component that the other report presents separately. Read the notes and ledger mapping before combining lines.
Accounting-policy and estimate changes also affect comparison. ICAI AS 1 explains why policies are necessary for understanding financial statements, while AS 5 addresses relevant profit reporting and changes under the AS framework. The treatment of a correction or policy change depends on the applicable requirements; an analytical spreadsheet is not authority to restate statutory accounts.
Build a stable row structure
Use rows that reflect the business’s important economics. A trader might show net sales, cost of goods sold, gross profit, distribution costs, administration, depreciation, finance costs and final profit. A service business may need project labour and subcontracting rows instead of goods costs.
For the balance sheet, keep equipment, inventory, receivables, cash, borrowings, supplier dues and owner funds separate where material. Map both periods into the same analytical categories. Retain an unmapped-ledger check so that regrouping does not accidentally omit a balance.
Where last year’s expense is moved to a different row for comparison, show the original amount and a regrouping note or reconciliation. Readers should be able to understand both the analytical layout and the signed report from which it came.
Calculate rupee and percentage changes
Absolute change = current year − previous year. Percentage change = absolute change ÷ previous year × 100, provided the prior-year base makes that calculation meaningful. Use a consistent sign convention and identify whether an expense increase is favourable or adverse in context.
Consider an illustrative Ahmedabad industrial-supplies business:
| Item | Previous year | Current year | Change | Change % |
|---|---|---|---|---|
| Net sales | ₹80 lakh | ₹100 lakh | ₹20 lakh | 25% |
| Cost of goods sold | ₹56 lakh | ₹74 lakh | ₹18 lakh | 32.1% |
| Gross profit | ₹24 lakh | ₹26 lakh | ₹2 lakh | 8.3% |
| Operating expenses | ₹16 lakh | ₹19 lakh | ₹3 lakh | 18.8% |
| Operating profit | ₹8 lakh | ₹7 lakh | −₹1 lakh | −12.5% |
Revenue grew strongly, but operating profit fell. The largest question is the ₹18 lakh cost increase accompanying ₹20 lakh more sales. The table points the reviewer toward purchase prices, discounting and sales mix rather than supporting a simple “growth was good” conclusion.
Use percentage points for margins
The example’s gross margin fell from 30% to 26%, a decline of four percentage points. Operating margin fell from 10% to 7%, a decline of three percentage points. Calling the first movement a “4% fall” is ambiguous because the relative decrease in the margin rate is actually 13.3%.
Show both rupee profit and margin. A business can earn more gross profit while retaining less from every sales rupee. The owner then needs to know whether additional volume generates enough contribution to fund operating costs and working capital.
Balance-sheet movements complete this picture. If receivables rose from ₹12 lakh to ₹22 lakh while sales grew 25%, collections may have slowed, or year-end sales timing may explain the movement. Test the ageing and credit-sales pattern before deciding.
Handle difficult comparison bases honestly
When the previous-year amount is zero, report the rupee movement and mark the percentage as not meaningful. A rise from zero to ₹2 lakh is not a finite 100% increase. If a line changes from a loss to a profit, explain the turnaround in rupees rather than relying on a confusing signed percentage.
Keep unusual gains or costs visible. Show an additional management bridge for recurring performance where useful, with every adjustment explained and reconciled to reported profit. A repeated “one-time” cost should trigger scrutiny rather than automatic removal.
When comparing cash flows, distinguish higher collections from higher borrowing and asset-sale receipts. Two years can show similar closing cash while relying on very different sources. A comparative cash bridge makes the funding change visible alongside the profit comparison.
Add commentary and a verification trail
For each material movement, record the cause, evidence and next action. “Rent increased 20%” repeats the table. “The July warehouse opening added nine months of rent, with full-year cost still to come” explains the implication.
Reconcile each column to the relevant financial statement, check formulas and verify that subtotals add. Review linked ratios using consistent numerator and denominator definitions. Company disclosures can require additional comparisons and explanations under applicable Schedule III requirements; an internal comparative table alone does not replace them.
Release the comparison with period dates, units, version and clear notes. The aim is to help the owner distinguish genuine improvement, emerging pressure and simple presentation changes before deciding what to do next.